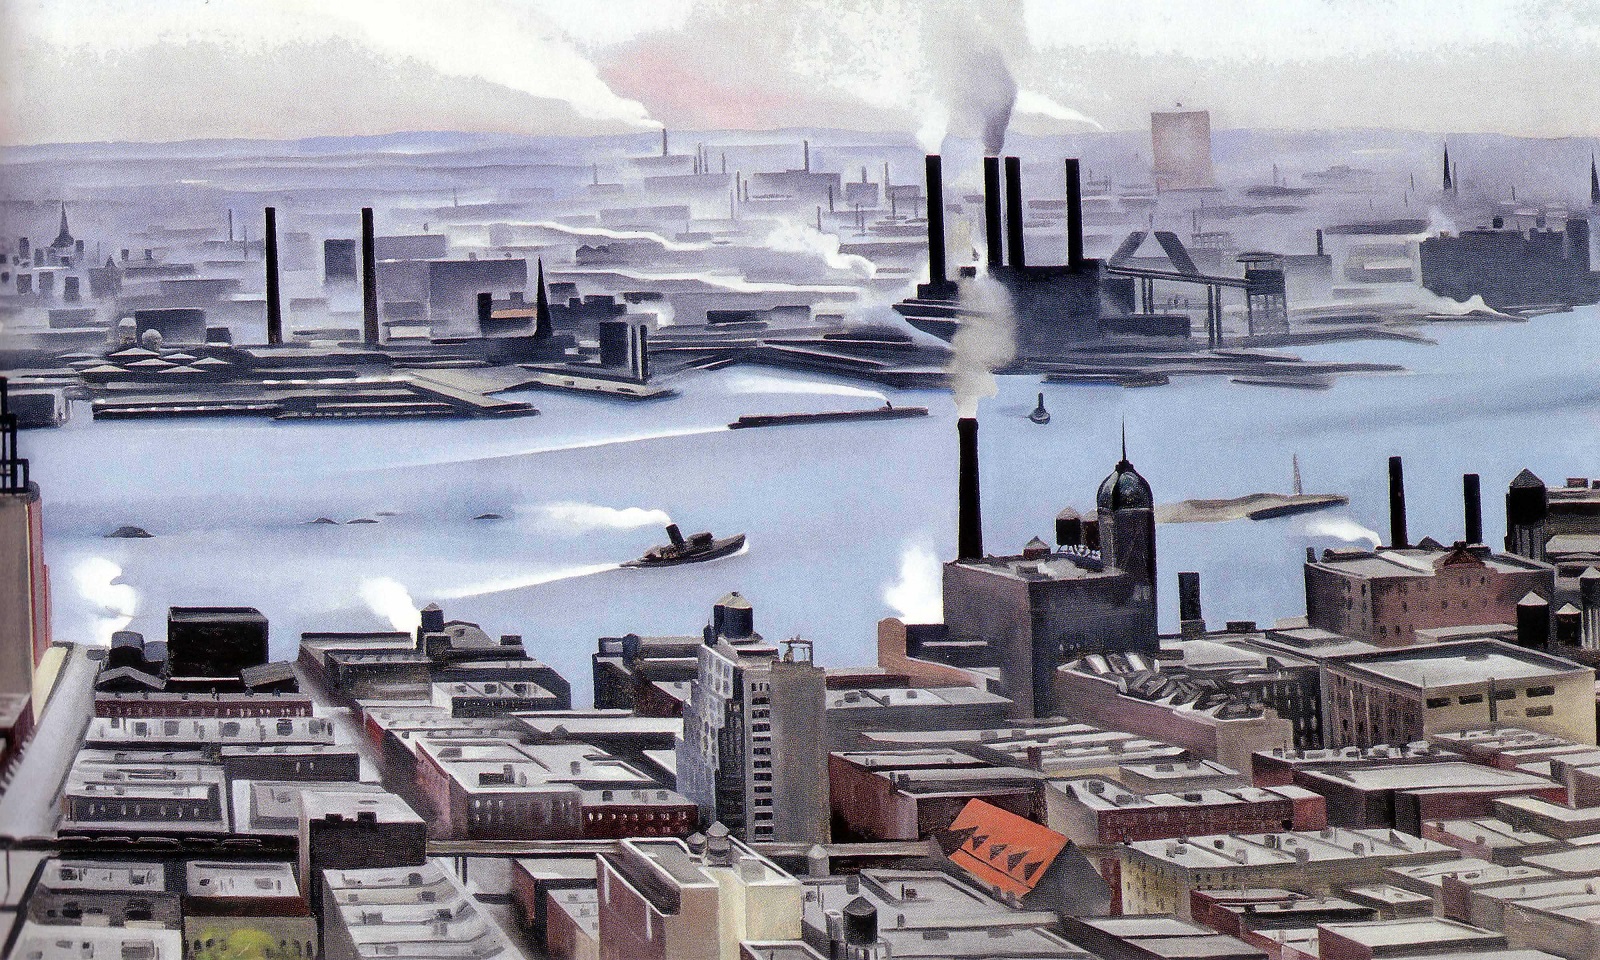
an atmospheric chemistry Lab at the University of virginia
read our recent work


recent coverage of our work

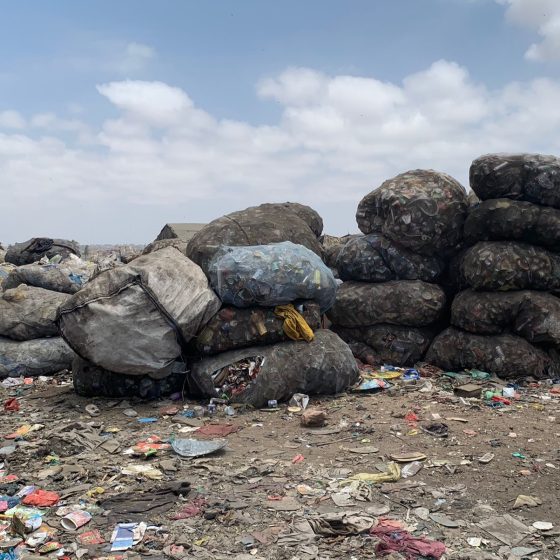
We can see factory farm pollution all the way from space. But communities of color face the worst ammonia pollution on the ground
Led by Akirah Epps and Isabella Dressel, we use satellite data to observe inequalities and evaluate policies around industrialized swine operations in North Carolina
February 9, 2025

President Biden honors nearly 400 federally funded early-career scientists
Sally Pusede received the Presidential Early Career Award for Scientists and Engineers (PECASE) from the Biden Administration and NSF